Client:
A data compiler partner of AMI had a long-term customer that provides automotive insurance and services and were interested in better understanding what made their customer base unique.
Challenge:
Developing profiles is a standard task for AMI, but in this case the client wanted to be able to simultaneously visualize the customer profile versus multiple key demographic variables. They asked AMI to create a compelling visualization that would allow them to see the relative differences at a glance.
Approach:
AMI partner Holt Analytics has a go-to solution in the analytic toolbox that AMI utilized in this case.
Results:
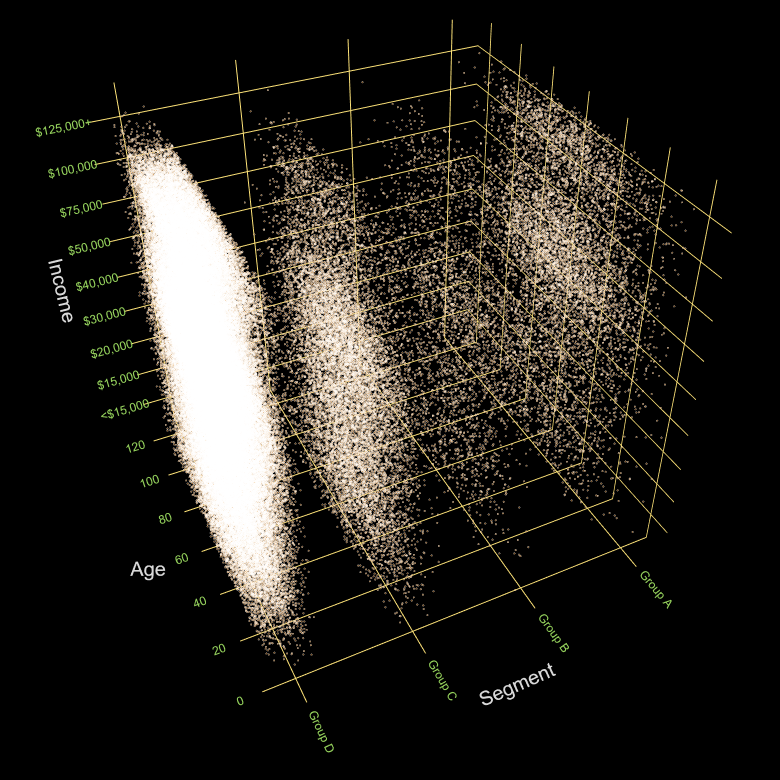
As you can see from the attached examples (simultaneously describing how a sample population arrays for age, income, and ethnicity), the data can be presented (among other ways) in either cloud or index formats, to give the client the ability to see key distinctions across multiple fronts in an integrated, three-dimensional view. The view can be rotated, zoomed in or out, and provides clients with a compelling, outside the box way to think about their data.
Use our Interactive Data Visual Model below to explore example graphical representations of data: